West 30A is seeing faster price growth than East 30A, making it crucial to choose a 30A neighborhood that fits your investment goals. By late 2025, West 30A's median prices jumped 11.4% year-over-year, while East 30A's median prices dropped 27.9%. East 30A offers more negotiation opportunities for buyers, with homes staying on the market longer and sellers accepting lower offers. Meanwhile, West 30A has tighter inventory and rising demand, making it more competitive for buyers.
Key Insights:
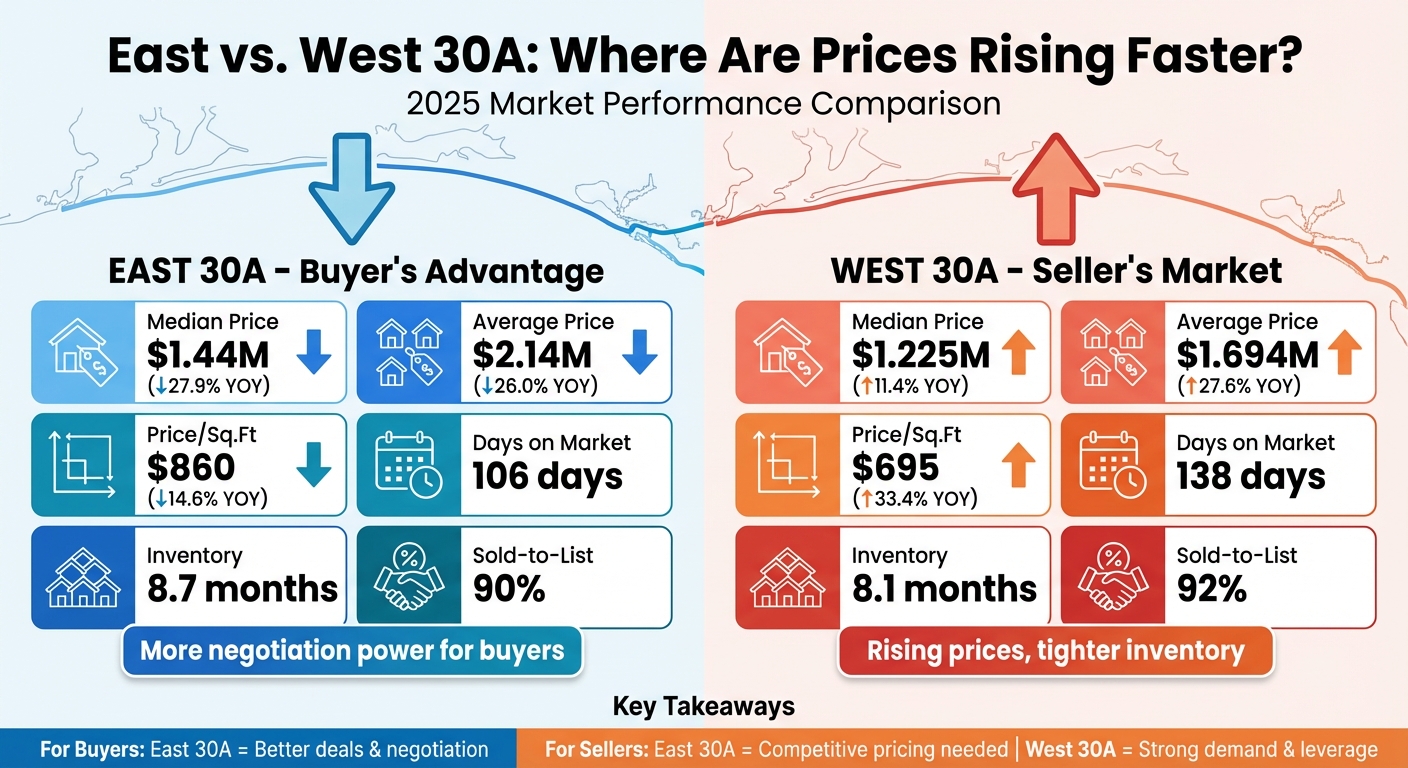
- East 30A: Median price fell to $1.44M in October 2025, with a 30.6% year-over-year drop by December. Buyers have more room to negotiate, but sellers face longer market times and lower sale-to-list ratios.
- West 30A: Median price reached $1.225M in December 2025, with a 52.3% year-over-year increase earlier in the year. Inventory tightened, and homes sold faster, reflecting strong buyer interest.
For buyers: East 30A offers luxury properties at reduced prices, while West 30A requires quicker decisions due to rising prices and limited inventory.
For sellers: East 30A sellers need competitive pricing and staging, while West 30A sellers benefit from higher demand but must present move-in-ready homes.
Quick Comparison
| Metric | East 30A (Oct 2025) | West 30A (Dec 2025) |
|---|---|---|
| Median Sold Price | $1.44M (-27.9% YOY) | $1.225M (+11.4% YOY) |
| Average Sold Price | $2.14M (-26.0% YOY) | $1.694M (+27.6% YOY) |
| Price Per Sq. Ft. | $860 (-14.6% YOY) | $695 (+33.4% YOY) |
| Days on Market | 106 days | 138 days |
| Inventory Months | 8.7 months | 8.1 months |
| Sold-to-List Ratio | 90% | 92% |
Bottom Line: East 30A buyers can negotiate better deals, but sellers must adjust expectations. West 30A is heating up, with rising prices and stronger seller leverage.
East vs West 30A Real Estate Market Comparison 2025
East 30A Price Trends
The East 30A real estate market experienced some noticeable changes in 2025, with prices taking a downturn while sales activity picked up pace. By the close of the year in December, the median sold price had fallen to $1.375 million, a 30.6% drop compared to the previous year. Meanwhile, the average sold price landed at $2.153 million, reflecting a 17.1% decrease. The price per square foot also declined, settling at $842, which was 10.1% lower than December 2024.
Interestingly, while prices dipped, sales activity soared. October 2025 saw 88 homes sold, marking a 54.4% increase year-over-year. Pending sales also climbed by 42.2%, highlighting a dynamic shift in buyer behavior and market conditions.
Key Metrics for East 30A
The inventory trends in East 30A paint a fascinating picture of the market's adjustment. After hitting a peak of 14.1 months of inventory in July 2025, supply tightened significantly to 6.2 months by December. Homes were staying on the market for an average of 118 days in December, signaling that buyers were taking more time to weigh their options.
The sale-to-list price ratio hovered between 90% and 92% throughout the year. This indicates that sellers were accepting offers below their asking prices, a stark contrast to the competitive bidding wars seen in 2021 and 2022, where buyers often paid above asking.
What's Driving East 30A Trends
Local agent Candice KausHagen describes the market changes as part of a natural adjustment, not a dramatic downturn:
The slide looks more like a rebalancing than a retreat.
She underscores that East 30A remains a luxury market that has simply returned to more measured pricing levels after several years of soaring values.
Another critical factor is the shift in buyer mentality:
Buyers are still out there - they're just moving with intention, not FOMO.
The frantic, fear-of-missing-out mindset that once spurred hasty purchases has been replaced by a more deliberate approach. Buyers are now taking their time, negotiating longer, and scrutinizing every aspect of a potential purchase. Homes that aren’t priced competitively or presented well are sitting on the market longer, prompting sellers to adjust their expectations to align with the current market realities.
sbb-itb-d06eda6
West 30A Price Trends
While East 30A faced a downturn throughout 2025, the western stretch of the coastline told a completely different story. West 30A rebounded strongly in the latter part of the year, with prices climbing across nearly every metric. By October 2025, the median sold price hit $1.35 million - a 50% jump from the previous month and a 4.8% increase compared to the previous year. Even more striking, the average sold price soared to $2.45 million, reflecting a 53.3% month-over-month rise and a 52.3% year-over-year gain. This sharp uptick stands in stark contrast to the declining trends seen in East 30A.
Momentum carried into December 2025, with 41 homes sold - a 24.2% increase year-over-year and a staggering 105% rise from November. During this time, the median sold price settled at $1.225 million, marking an 11.4% year-over-year increase. The average sold price reached $1.694 million, up 27.6% from the previous year. Price per square foot also climbed to $695 in December, reflecting a 33.4% rise compared to the same period in 2024.
Local agent Candice KausHagen summed up the shift:
The west end of 30A came in hot this month. Prices surged across the board, contracts spiked, and sellers saw faster movement than earlier this fall.
Key Metrics for West 30A
The numbers tell the story of a market heating up fast. Active listings fell 12.9% month-over-month in December 2025, bringing inventory down to 8.1 months - a 25% drop from the previous year. Homes were selling quicker too, averaging 138 days on the market in December, which is a 17.9% decrease year-over-year.
Pending contracts showed a similar surge, jumping 47.8% year-over-year by October 2025. That month alone, 34 homes went under contract - a 25.9% increase from September. The sold-to-original list price ratio climbed to 92% in December, up slightly from 91% in October, indicating that sellers were making fewer price concessions as demand intensified. Additionally, the absorption rate for closed sales saw a remarkable 135.3% month-over-month improvement in December, further highlighting the growing buyer interest. These metrics paint a clear picture of a market rapidly gaining strength.
What's Driving West 30A Growth
The tightening inventory and increased buyer urgency can be traced to a few key factors. New listings dropped 4.1% month-over-month in late 2025, making competition for available homes even fiercer. Unlike East 30A, where buyers have been more hesitant, West 30A buyers are acting quickly, particularly when it comes to move-in-ready, turnkey properties.
Neighborhoods like Blue Mountain Beach, Dune Allen, and Grayton Beach are at the forefront of this resurgence. These areas are attracting buyers with homes that boast sought-after features like private saltwater pools, carriage houses, and gourmet kitchens outfitted with high-end appliances. As Candice KausHagen noted:
30A West closed out 2025 with stronger sales, rising prices, and tightening inventory - all signs of renewed momentum.
Although both ends of 30A technically remain buyer’s markets, the West is becoming "suddenly a lot more competitive" as prices rise and inventory shrinks. Sellers who price their homes wisely and present them well are reaping the benefits of quicker sales and stronger price retention compared to their counterparts on the East end.
East vs. West 30A: Side-by-Side Comparison
Comparison Table
The numbers tell the story of two markets heading in opposite directions. While East 30A saw a slowdown throughout 2025, West 30A gained momentum, particularly in the year’s final months.
| Metric | East 30A (Oct 2025) | West 30A (Dec 2025) |
|---|---|---|
| Median Sold Price | $1.44M (-27.9% YOY) | $1.225M (+11.4% YOY) |
| Average Sold Price | $2.14M (-26.0% YOY) | $1.694M (+27.6% YOY) |
| Price Per Sq. Ft. | $860 (-14.6% YOY) | $695 (+33.4% YOY) |
| Days on Market | 106 days (-27.9% YOY) | 138 days (-17.9% YOY) |
| Inventory Months | 8.7 months (-34.5% YOY) | 8.1 months (-25.0% YOY) |
| Sold-to-List Ratio | 90% | 92% |
What the Numbers Mean
This comparison highlights the diverging paths of East and West 30A, revealing distinct market dynamics.
West 30A is pulling ahead in price growth. The price per square foot in the West surged by 33.4%, while the East dropped by 14.6%. This suggests that buyer demand and market strength are shifting westward, leaving the East in a more subdued phase.
Inventory levels also reflect these differences. Both areas still lean toward a buyer’s market, with over eight months of supply. However, West 30A is tightening faster, sitting at 8.1 months of inventory compared to East 30A’s 8.7 months. This lower supply in the West signals increasing competition among buyers, while the East offers more room for negotiation.
The sold-to-list price ratio further illustrates buyer and seller dynamics. In West 30A, homes are selling at 92% of their original list price, showing sellers are holding firmer on their pricing. In contrast, East 30A’s 90% ratio indicates buyers have slightly more leverage. On a $1.5 million home, that 2% difference could mean $30,000 - whether it’s a savings for buyers or a loss for sellers depends on the side you’re on.
These numbers provide a clear roadmap for tailoring strategies, whether you’re buying or selling in these markets.
What This Means for Buyers and Sellers
Opportunities for Buyers
The contrasting trends in East and West 30A create unique opportunities for buyers, shaped by inventory levels and shifting prices.
East 30A offers buyers strong negotiation power. With 8.7 months of inventory and an average of 106 days on the market, there's room to negotiate, especially with listings that have lingered unsold. Sellers in this area are more likely to entertain offers, particularly for properties that haven't moved.
The 27.9% drop in prices compared to last year opens up access to luxury communities that were previously out of reach. For instance, Gulf-view condos in Seagrove are now listed under $1 million, such as a 3-bedroom, 3-bath unit priced at $995,000. Buyers who were priced out of areas like Rosemary Beach or Alys Beach last year may now find opportunities to enter these markets.
West 30A, on the other hand, requires quick action. A 105% month-over-month jump in closed sales in December 2025 shows that competition is intensifying. With inventory tightening to 8.1 months and prices rising 11.4% year-over-year, the window for negotiation is shrinking. Local agent Candice KausHagen emphasizes the importance of acting swiftly in this increasingly competitive market.
While buyers navigate these distinct dynamics, sellers must adapt their strategies to align with the evolving conditions.
Strategies for Sellers
Market trends in East and West 30A call for tailored approaches. Sellers in West 30A should focus on speed and presentation, while those in East 30A need to adjust to a buyer-driven environment.
West 30A sellers should prioritize move-in-ready listings. Buyer demand is high, rewarding properties that are turnkey and well-prepared for immediate occupancy. With a sold-to-list ratio of 92%, sellers in this area are holding firm on pricing. To maximize success, focus on presenting homes that feel complete and require minimal work. The current market favors properties that are polished and ready to go. For more insights on the area, check out our local guides to the Emerald Coast.
East 30A sellers must embrace realistic pricing and top-notch presentation. With a sold-to-list ratio of 90%, buyers are negotiating harder, and overpricing will likely lead to extended time on the market. As KausHagen points out:
Gone are the days of 'list it and let the market do the work.' Today, success means staging, realistic pricing, and marketing that reaches the right audience.
Professional staging is no longer optional - it’s a critical factor in reducing the average 106 days on the market and standing out in a competitive inventory landscape.
Conclusion
The numbers tell a clear story: West 30A is outpacing East 30A in price growth. By October 2025, East 30A saw a 27.9% year-over-year drop in median prices, landing at $1.44 million. Meanwhile, West 30A experienced an 11.4% increase in median prices, reaching $1,225,000 by December 2025. West 30A ended the year with a 105% month-over-month surge in sales and a 27.6% year-over-year jump in average sold prices, signaling strong momentum.
These shifting dynamics are reshaping buyer and seller behavior. East 30A’s market, cooling from its previous highs, now gives buyers more room to negotiate. On the other hand, West 30A’s tightening market - with inventory shrinking 25% year-over-year and homes selling 17.9% faster - requires buyers to act quickly. Local agent Candice KausHagen summed it up perfectly:
30A West closed out 2025 with stronger sales, rising prices, and tightening inventory.
For buyers, East 30A presents an opportunity to negotiate, while sellers must focus on realistic pricing and staging to attract offers. Over on West 30A, sellers benefit from competitive conditions, but buyers face pressure to move fast in a market with limited options.
Keeping up with these trends is crucial for making informed decisions. Head to sowal.co for real-time updates on 30A real estate. The site offers expert insights, forums, and tools to stay ahead of the shifts along the 30A coastline.
FAQs
Why are property prices increasing more quickly in West 30A than in East 30A?
Property prices in West 30A are on the rise, driven by several factors, including an 18% increase in median sales prices, now sitting just below $1.8 million. Interestingly, while the price per square foot has dipped slightly, the overall trend reflects strong buyer interest and a market focused on high-value transactions.
For buyers, this signals the need to act decisively to secure properties before prices climb even higher. For sellers, the current conditions present a prime opportunity to benefit from the market's upward momentum. Whether you're buying or selling, staying informed about these changes is key to making smarter decisions.
What’s driving the competitive housing market in West 30A?
West 30A’s housing market is experiencing some interesting shifts. Inventory has seen a modest increase, up about 9% from last year, but the supply of homes remains tight. On the other hand, home sales have taken a sharp dip, dropping 41% year-over-year. This suggests that many buyers are either holding off or waiting for more favorable conditions.
Even with fewer transactions, median home prices have climbed by 18%, now approaching $1.8 million. This rise underscores the demand for attractive properties in the area. At the same time, homes are spending more time on the market - averaging about two months. This indicates the market may be becoming more balanced, giving buyers a bit more leverage to negotiate. Still, competition remains strong, especially for homes that are priced right and catch buyers' attention.
What should buyers and sellers know about the changing markets on East and West 30A?
The real estate markets along East 30A and West 30A are showing clear differences, and understanding these shifts can give buyers and sellers an edge.
West 30A is solidly a seller’s market right now. Median home prices have jumped by 18%, and inventory remains tight. While buyers may have to contend with higher price tags, the longer selling times for homes could open up room for negotiation. For sellers, realistic pricing is crucial to attract serious offers, but the strong demand works in their favor.
Meanwhile, East 30A is leaning toward a buyer’s market. Prices are either holding steady or dipping slightly, and there’s more inventory to choose from. This gives buyers better negotiating power and more options. Sellers, however, might need to price their homes competitively and be ready for a longer wait to close a deal.
Whether you’re buying or selling along the 30A coastline, keeping up with these local trends is essential for making informed decisions.